안녕하세요. Fabric 서비스를 이용 중인 사용자입니다.
현재 Fabric에서 여러 프로세스를 동시에 운영하고 있어 메모리 사용량이 높은 상황입니다. 다만, Fabric Capacity CU 사용률이 100%에 도달하지 않았음에도 불구하고 Fabric 쿼리 및 함수 실행 시 아래와 같은 메모리 관련 오류가 발생하고 있습니다.
메모리 부족 현상이 CU 사용률과는 별개의 기준으로 관리되는 것인지, 메모리 제한을 두고 있어서 그런건지 확인 부탁드립니다. 해당 오류의 원인을 파악하고 해결하고자 문의드립니다.
추가로, Capacity와 메모리가 서로 다른 개념이라면 현재 사용 가능한 메모리(또는 메모리 사용량)를 확인할 수 있는 방법이나 관련 모니터링 지표가 있는지도 함께 안내해 주시면 운영 및 모니터링에 큰 도움이 될 것 같습니다.
감사합니다.
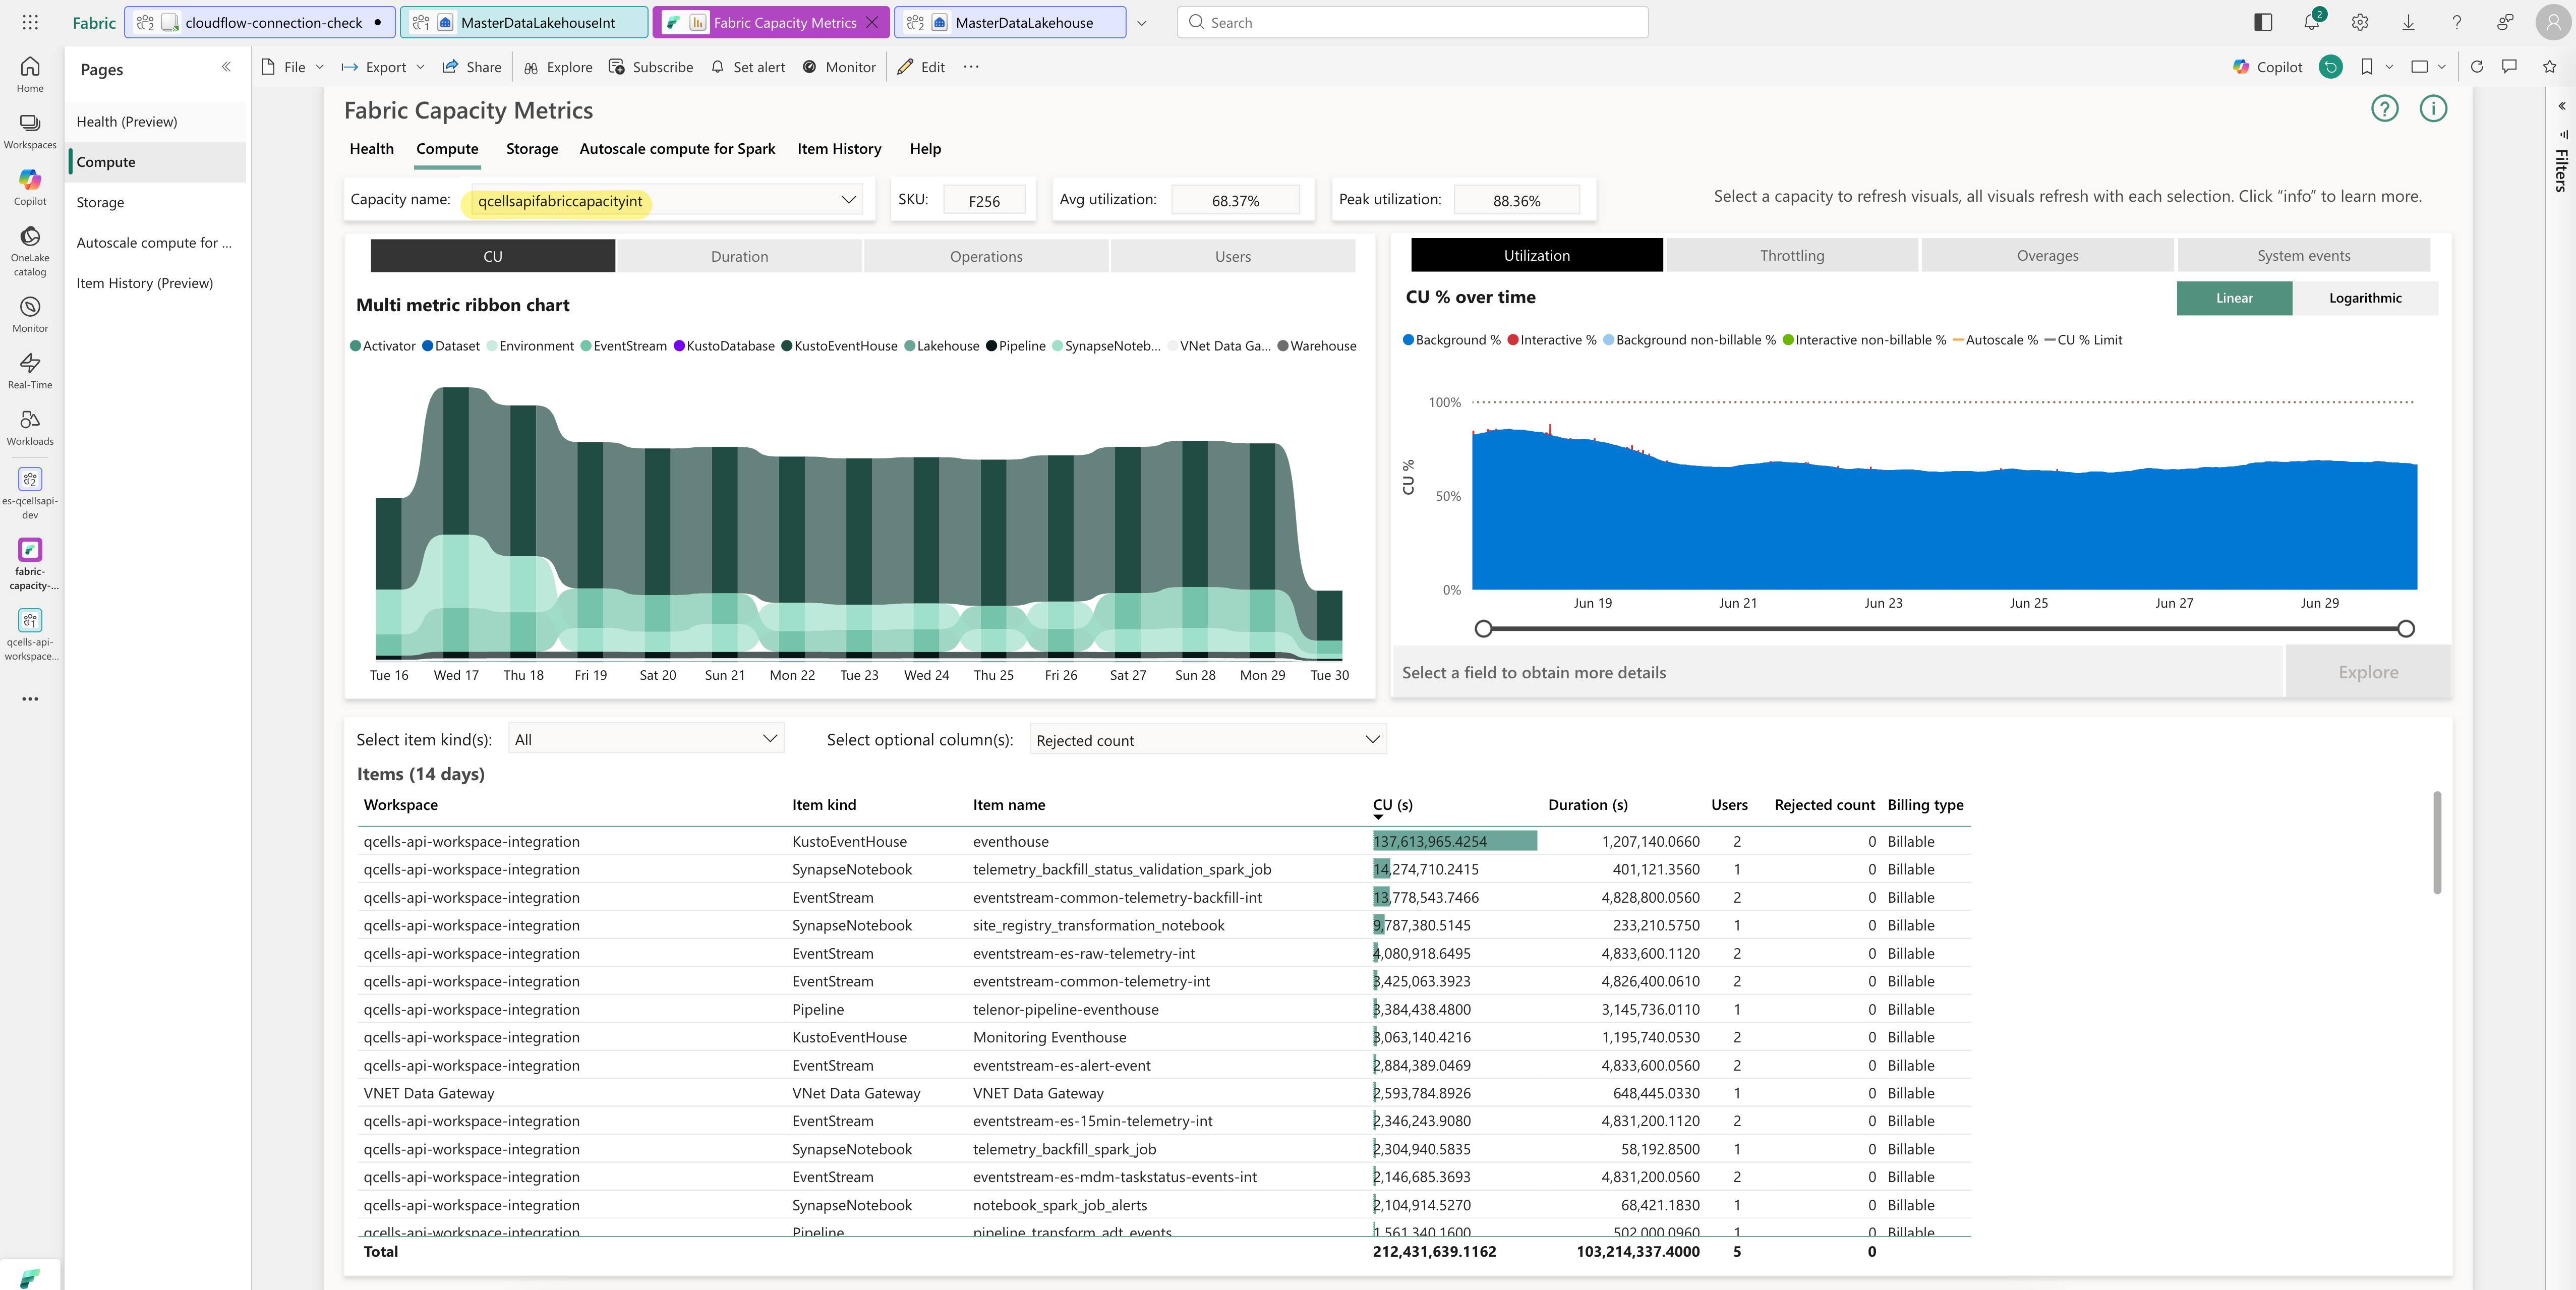
- Fabric Capacity Metrics
- Capacity name: qcellsapifabriccapacityint
- Fabric 함수 및 쿼리 실행 시 오류 메시지
- PartialQueryEvaluator: Query execution lacks memory resources to complete (80DA0007): multiple errors occurred: Partial query error ({"shard_id":"d420b3b2-b14c-4da6-9863-a88914dbd601"}), source: (hr: '2161770503' 'Engine under memory pressure, context: apply_buf_p_to_val')...
- An admin command cannot be executed due to a failure in the distributed ingestion: Details='-2133196793:{"Count":1,"Text":"Partial query failure: Low memory condition (E_LOW_MEMORY_CONDITION). (message: bad allocation (E_LOW_MEMORY_CONDITION))"}'
- Query execution lacks memory resources to complete (80DA0007): Partial query failure: Low memory condition (E_LOW_MEMORY_CONDITION). (message: 'hr: '2161770503' 'Engine under memory pressure, context: load query': ').
' cx='32' cy='32' r='32' /%3E%3Ctext x='50%25' y='55%25' dominant-baseline='middle' text-anchor='middle' fill='%23FFF' %3EKK%3C/text%3E%3C/svg%3E)